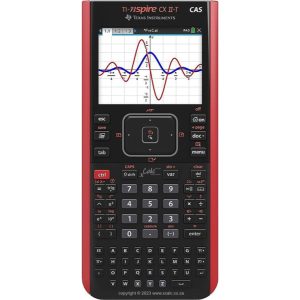
 TI-Nspire™ CX II CAS graphing calculator
TI-Nspire™ CX II CAS graphing calculator
R4,599.98
In stock at suppliers. If you want this calculator please send us an email.
The TI-Nspire™ CX II CAS graphing calculator features a built-in Computer Algebra System (CAS) engine that enables students to perform symbolic as well as numeric calculations.
- Performs computations and enter expressions, equations and formulas in proper math notation.
- Lists & Spreadsheet: Perform mathematical operations on data and visualize the connections between the data and their plots.
- Graphs: Plot and explore functions, equations and inequalities, animate points on objects and graphs, use sliders to explain their behavior and more.
- Data & Statistics: Summarize and analyze data using different graphical methods such as histograms, box plots, bar and pie charts and more.
- Geometry: Construct and explore geometric figures and create animations.
- Notes: Enter notes, steps, instructions and other comments on the screen alongside the math.
- Vernier DataQuest™ Application: Create a hypothesis graphically and replay data collection experiments all in a single application.
- Programming: Add new functionality and create rich STEM activities with Python and TI-Basic coding languages.
Built-in functionality
- Function, parametric, polar, sequence and 3D graphing
- Multiple graphing functions can be defined, saved, graphed and analyzed at one time
- User-defined list names in Lists & Spreadsheet
- Eleven interactive zoom features
- Numeric evaluations in table format for all graphing modes
- Interactive analysis of function values, roots, maximums, minimums, integrals and derivatives
- Six different graph styles and 15 colors to select from for differentiating the look of each graph drawn
- Matrix operations: transpose and augment matrices; use elementary row operations; find inverse, determinant and reduced row echelon forms; convert matrices to lists and vice versa; calculate eigenvalues and eigenvectors
- List-based one- and two-variable statistical analysis, including logistic, sinusoidal, median-median, linear, logarithmic, exponential, power, quadratic polynomial, cubic polynomial, and quartic polynomial regression models
- Three statistical plot definitions for scatter plots, xy-line plots, histograms, regular and modified box-and-whisker plots, and normal probability plots
- Advanced statistics analysis, including 10 hypothesis testing functions, seven confidence interval functions and one-way analysis of variance
- Eighteen probability distributions functions, including the cumulative distribution function (CDF), probability density function (PDF) and inverse probability distribution function for normal, chi-squared, t-, and F- distributions; and the CDF and PDF for binomial, geometric and Poisson distributions
- Built-in interactive geometry capabilities
- Quick alpha keys
- Simple drop-down menus emulate the intuitive operation of familiar computer features
- TI-Nspire™ Documents (.tns files) can be created, edited, saved and reviewed
- Support for .tns files containing images (.jpeg, .jpg, .bmp, .png formats) that are overlaid with graphical elements or inserted on interactive notes pages
- Explore mathematical expressions in symbolic form, see patterns and understand the math behind the formulas
- Visualize multiple representations of a single problem-algebraic, graphical, geometric, numeric and written
- Chem Box feature allows easy input of chemical formulas and equations
- Manipulate linked representations of properties to instantly update the others and show meaningful connections without switching screens (for example, grab a graphed function and move it to see the effect on corresponding equations and data lists)
| Weight | 1 kg |
|---|---|
| Dimensions | 40 × 30 × 18 cm |
Only logged in customers who have purchased this product may leave a review.
Reviews
There are no reviews yet.